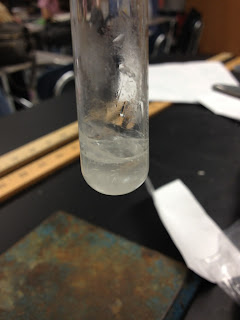
Monday, March 26, 2012

Heating and Cooling Curve

(Partner: Victoria L.)


Observations:


Data:
Cooling – Part 1                                                                     Heating – Part 2                

Time (min)
T (oC)
Time (min)
T (oC)


Time (min)
T (oC)
Time (min)
T (oC)
0

 70
3.5

 48


0

 37
3.5

 77
0.5

 66
4.0

 46


0.5

 53
4.0

 78
1.0

 63
4.5

 44


1.0

 64
4.5

 81
1.5

 60
5.0

 42


1.5

 70
5.0

 84
2.0

 57
5.5

 40


2.0

 74
5.5

 86
2.5

 54
6.0

 38


2.5

 75
6.0

 88
3.0

 51
6.5

 37


3.0

 77
6.5

 90

Analysis:


Questions:
1. Based on your graph, determine the melting and freezing point of the substance used. How do these values compare? 
63 and 64 degrees. They met at those points at the same time and are very close. Both came to these tempertures at a minute in to recording the temperature and thats how they compare.

2.
Describe the shape of your graph during the actual changes of state (while the substance
is actually melting or solidifying).
When it was soldifying it was at a steady pace gradually geting slower. The shape of the line remained pretty straight. When it was melting it shot up at first then moved more gradually. The shape shows an instant change at first then slowing down as depicted in the line of the graph.

3.
During the heating process, heat is continually being supplied to the sample throughout the entire time of the experiment even though the temperature remains constant during the actual change of phase. How can this be explained at the molecular level, in terms of what is happening to the chemical bonds holding the particles together in the solid state?
When the molecules heat up it vibrates them making it turn into a liquid. The molecules are able to move around because the bonds are breaking. When it was a solid the molecules were together tight and when they are a liquid they can move around more. The molecules slow down and start to cool.

4.
Consider the diagonal region of the cooling curve, as the sample is being cooled. What does the temperature change indicate about the change in kinetic energy of the particles in the sample?
When it begins to cool the kinetic energy of the particle is not as great. There is more space between the particle and the molecules slow down making it become solid.

Thursday, March 22, 2012

Determining the Volume of a Product

(Partner: Victoria L.)

Procedure:

1) Put on safety goggles.
2) Put 3g NaHCO3 (baking soda) in the balloon.
3) Add 70ml HC2H8O2 (vinegar) to the Erlenmeyer flask.
4) Place the balloon over the top of the flask letting the baking soda drop into the flask.
5) When the reaction is complete, and the balloon stops inflating, take the string and tie off the balloon.
6) Place balloon in a beaker filled with 600ml of water until it is fully submerged. (new level: 1300ml water)
7) The actual volume of the balloon is calculated by subtracting first water level from the second water level.

Observations:


Analysis:

1)


2-4)


5) The balloon may not have been completely tied off, which would cause the volume to be lower. The first time we put the balloon in the water, the water level was too high and it overflowed out of the beaker.

6) We made the amount of water in the beaker lower and tied off the balloon tighter to secure all of the CO2 inside.

Monday, March 19, 2012

Calculating the Ideal Gas Constant


(Partner: Caitlin M.)


Observations:


Data:

Length of Mg strip = 2.7 cm
Mass of Mg = 0.19 g
T=Temperature of Water (same as temp of H2 gas) = 23 oC = add 273 to give 296 K
Ptotal=Atmospheric Pressure = 0.99 atm
V=Volume of gas = 36 mL = 0.036

Calculations:

1)

2)
3)


4) 


5)


Post Lab Questions:


1) Why was it important for the stopper to have a hole in it? (What would happen if the stopper did not have a hole in it?)
- That way, we could make sure all of the air was out of the tube by putting the pipette through the hole and adding more water into the tube.


2) Why was it important to make sure that the eudiometer was filled completely with water before you inverted it? If it weren’t completely filled, how would this have affected the volume of H2 gas (too high or too low)? How would your value for R be affected? (Too high or too low?) Explain your reasoning.
- Because if it was not completely filled the volume of the gas in the tube would be a combination of H2 gas and air. It would make the volume of H2 too high and therefore the R too high.


3) How would the calculated number of moles of H2 gas (from calculation #2) be compared to your actual moles of H2 gas produced be affected if some of your magnesium did not react (Too high or too low)? How would your value for R be affected? (Too high or too low)? Explain your reasoning.
- If some of the magnesium didn't react, the moles of H2 gas would be too low because the H2 gas was formed from the chemical reaction of the magnesium and the liquid in the tube. To get the right amount of H2 gas, all of the magnesium would have to react. Since the volume of H2 was too low, the R would be too low as well.


4) When measuring the pressure of H2 gas in the tube. You rightly assumed that there was some water vapor in the tube along with the H2. Thus, you corrected our P value by subtracting out the pressure due to the water vapor. If you had not made this correction, would your pressure value be too high or too low? How would this have affected your R value? (Too high or too low)? Explain your reasoning.
- If we hadn't corrected the value of P, our pressure would have been too high because it would have included the pressure from the water vapor not just of the H2 gas. This also would have made the R value too high.


5) Was your value for R too high or too low? Give 2 reasons that could account for your specific results.
- Our R value was too low most likely because we lost some the contents in the tube as we transfered it over, which would lower the R value.