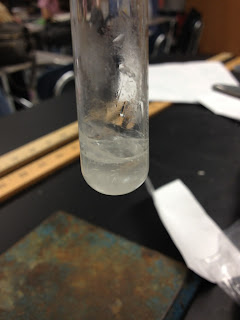
Observations:
Data:
Cooling – Part 1 Heating – Part 2
Time (min)
|
T (oC)
|
Time (min)
|
T (oC)
|
Time (min)
|
T (oC)
|
Time (min)
|
T (oC)
| ||
0
| 70 |
3.5
| 48 |
0
| 37 |
3.5
| 77 | ||
0.5
| 66 |
4.0
| 46 |
0.5
| 53 |
4.0
| 78 | ||
1.0
| 63 |
4.5
| 44 |
1.0
| 64 |
4.5
| 81 | ||
1.5
| 60 |
5.0
| 42 |
1.5
| 70 |
5.0
| 84 | ||
2.0
| 57 |
5.5
| 40 |
2.0
| 74 |
5.5
| 86 | ||
2.5
| 54 |
6.0
| 38 |
2.5
| 75 |
6.0
| 88 | ||
3.0
| 51 |
6.5
| 37 |
3.0
| 77 |
6.5
| 90 |
Analysis:
Questions:
63 and 64 degrees. They met at those points at the same time and are very close. Both came to these tempertures at a minute in to recording the temperature and thats how they compare.
2. Describe the shape of your graph during the actual changes of state (while the substance
is actually melting or solidifying).
When it was soldifying it was at a steady pace gradually geting slower. The shape of the line remained pretty straight. When it was melting it shot up at first then moved more gradually. The shape shows an instant change at first then slowing down as depicted in the line of the graph.
3. During the heating process, heat is continually being supplied to the sample throughout the entire time of the experiment even though the temperature remains constant during the actual change of phase. How can this be explained at the molecular level, in terms of what is happening to the chemical bonds holding the particles together in the solid state?
3. During the heating process, heat is continually being supplied to the sample throughout the entire time of the experiment even though the temperature remains constant during the actual change of phase. How can this be explained at the molecular level, in terms of what is happening to the chemical bonds holding the particles together in the solid state?
When the molecules heat up it vibrates them making it turn into a liquid. The molecules are able to move around because the bonds are breaking. When it was a solid the molecules were together tight and when they are a liquid they can move around more. The molecules slow down and start to cool.
4. Consider the diagonal region of the cooling curve, as the sample is being cooled. What does the temperature change indicate about the change in kinetic energy of the particles in the sample?
4. Consider the diagonal region of the cooling curve, as the sample is being cooled. What does the temperature change indicate about the change in kinetic energy of the particles in the sample?
When it begins to cool the kinetic energy of the particle is not as great. There is more space between the particle and the molecules slow down making it become solid.


#1 Freezing and melting occur at the same temperature because they are opposite processes. Per your graph that would be approximately 63 degrees.
ReplyDelete